Executive Summary
Is there a single formula for startup equity value?
No. A useful model multiplies ownership × exit proceeds per share (or exit value × your share of fully diluted) in each scenario, then probability-weights outcomes. Liquidity preferences can make ‘1% FD’ misleading at moderate exits.
What inputs matter most?
Fully diluted shares outstanding, your grant share count, preference stack and senior debt, exit type (IPO vs acquisition), and your personal discount rate for illiquidity.
Where do tools help?
Use the expected value calculator and job-offer comparison tool on this site to stress-test assumptions—not to predict the future.
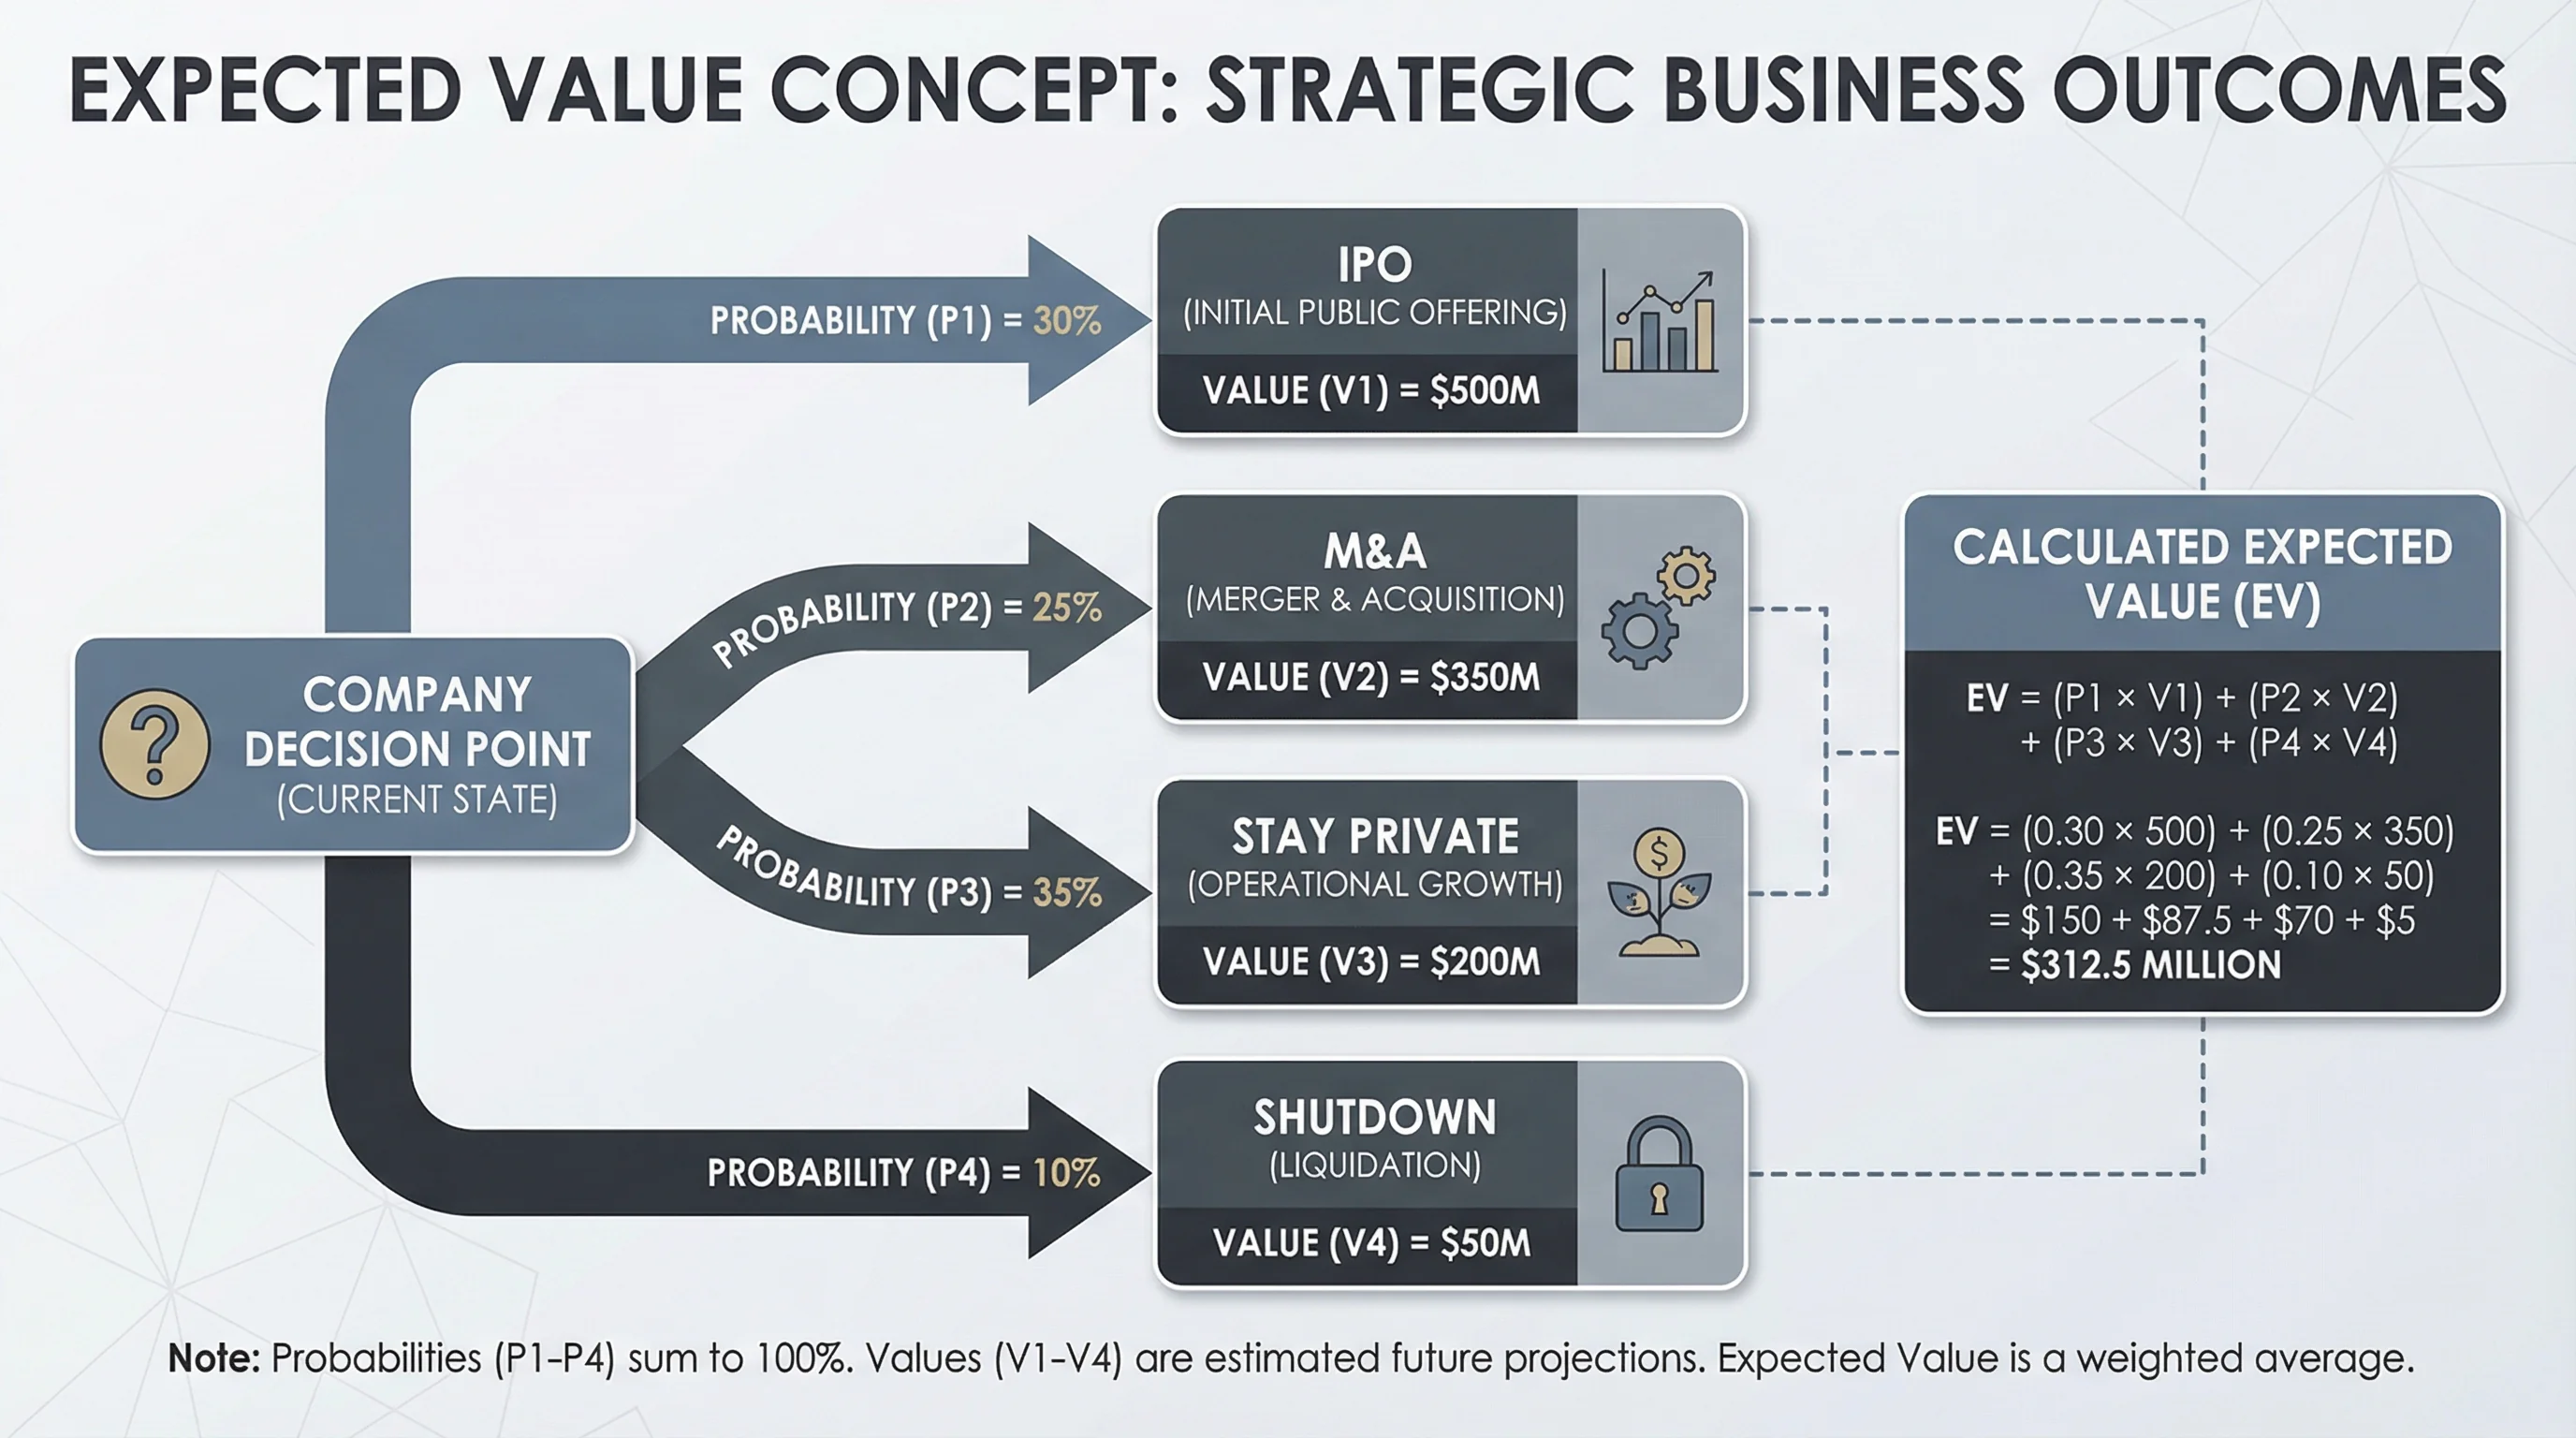
Figure 1: Probability-weighted framing—inputs are judgment calls, not facts.
Step 1 — Normalize the Grant
| Question | Why it matters |
|---|---|
| Shares or options? | Options need exercise cost; RSUs deliver shares at vest |
| FD percentage? | Ask how FD is computed (pool included or not) |
| Vesting | Back-weighted value to vesting years |
Step 2 — Scenario Table (Example Structure)
| Scenario | Probability | Equity value to you (illustrative) |
|---|---|---|
| Strong IPO | 10% | $X |
| M&A | 25% | $Y |
| Stay private / secondary | 40% | $Z |
| Down / shutdown | 25% | $0 |
Use our expected value calculator.
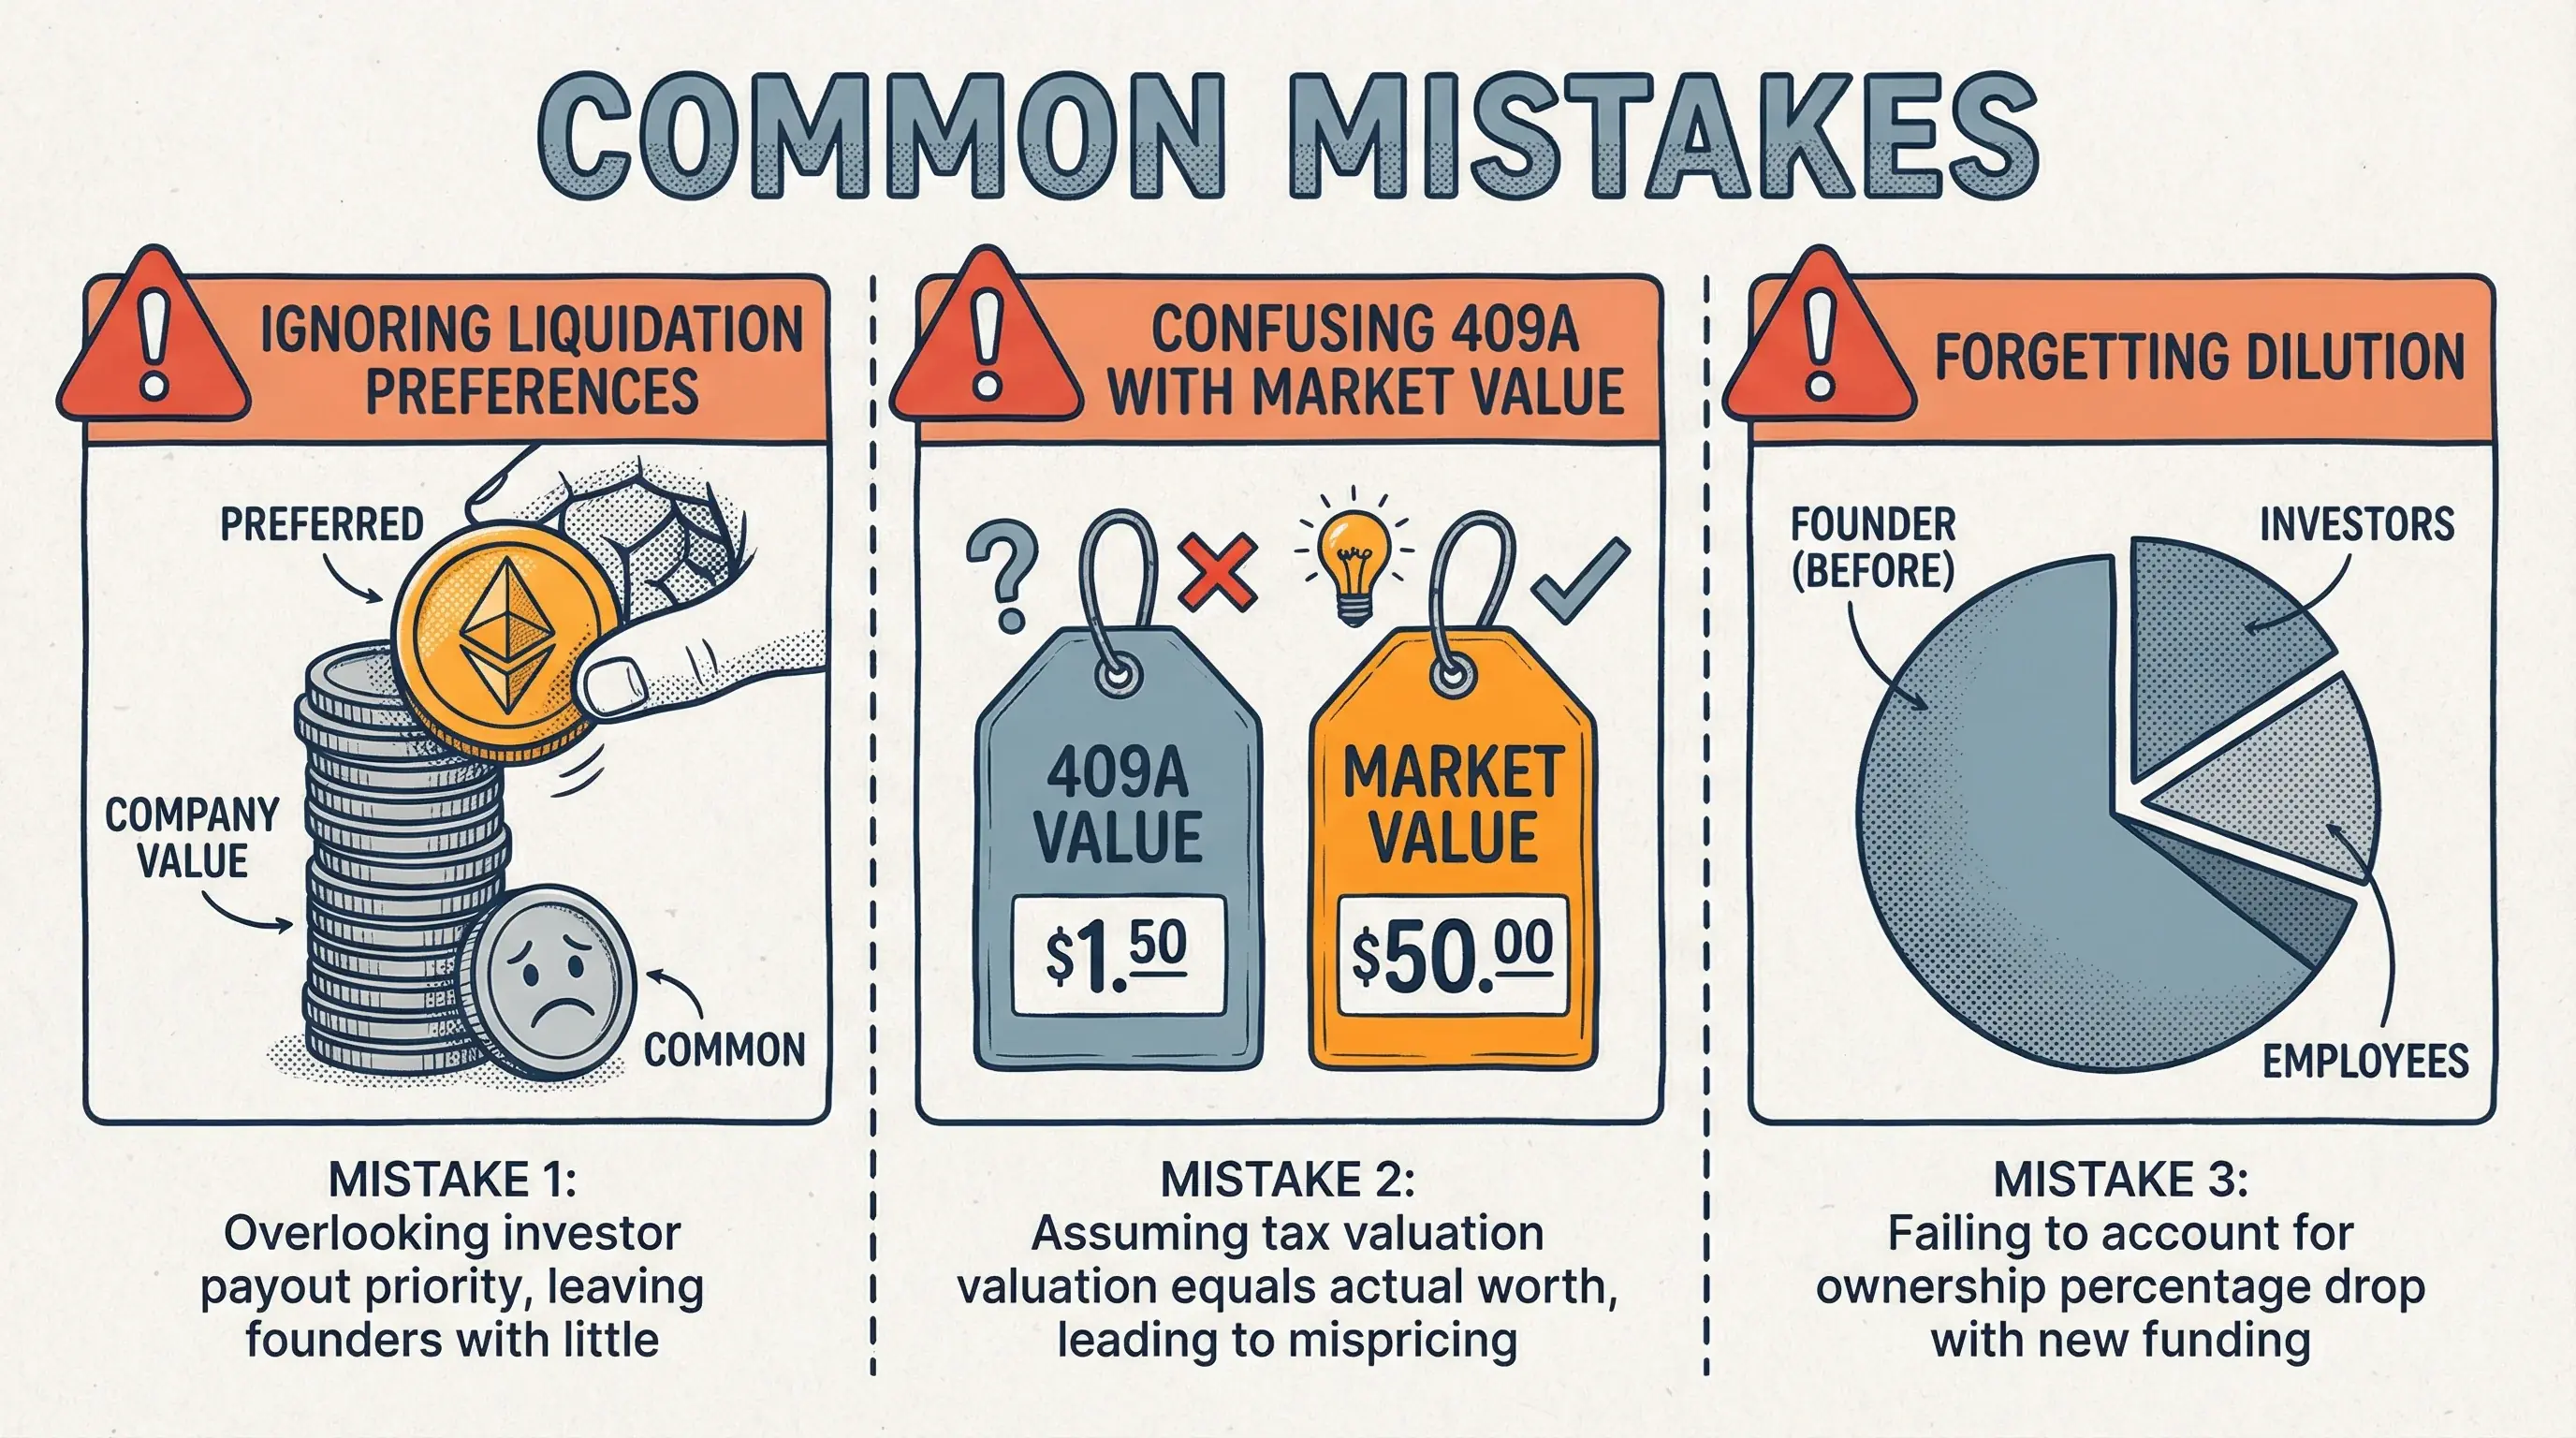
Figure 2: Where intuitive math breaks down for startup grants.
Step 3 — Dilution and Preferences (Qualitative)
- Later rounds increase FD share count
- Liquidation preferences can absorb early exit proceeds
Step 4 — Compare to Cash Offer
Use job offer comparison with explicit haircuts for risk.
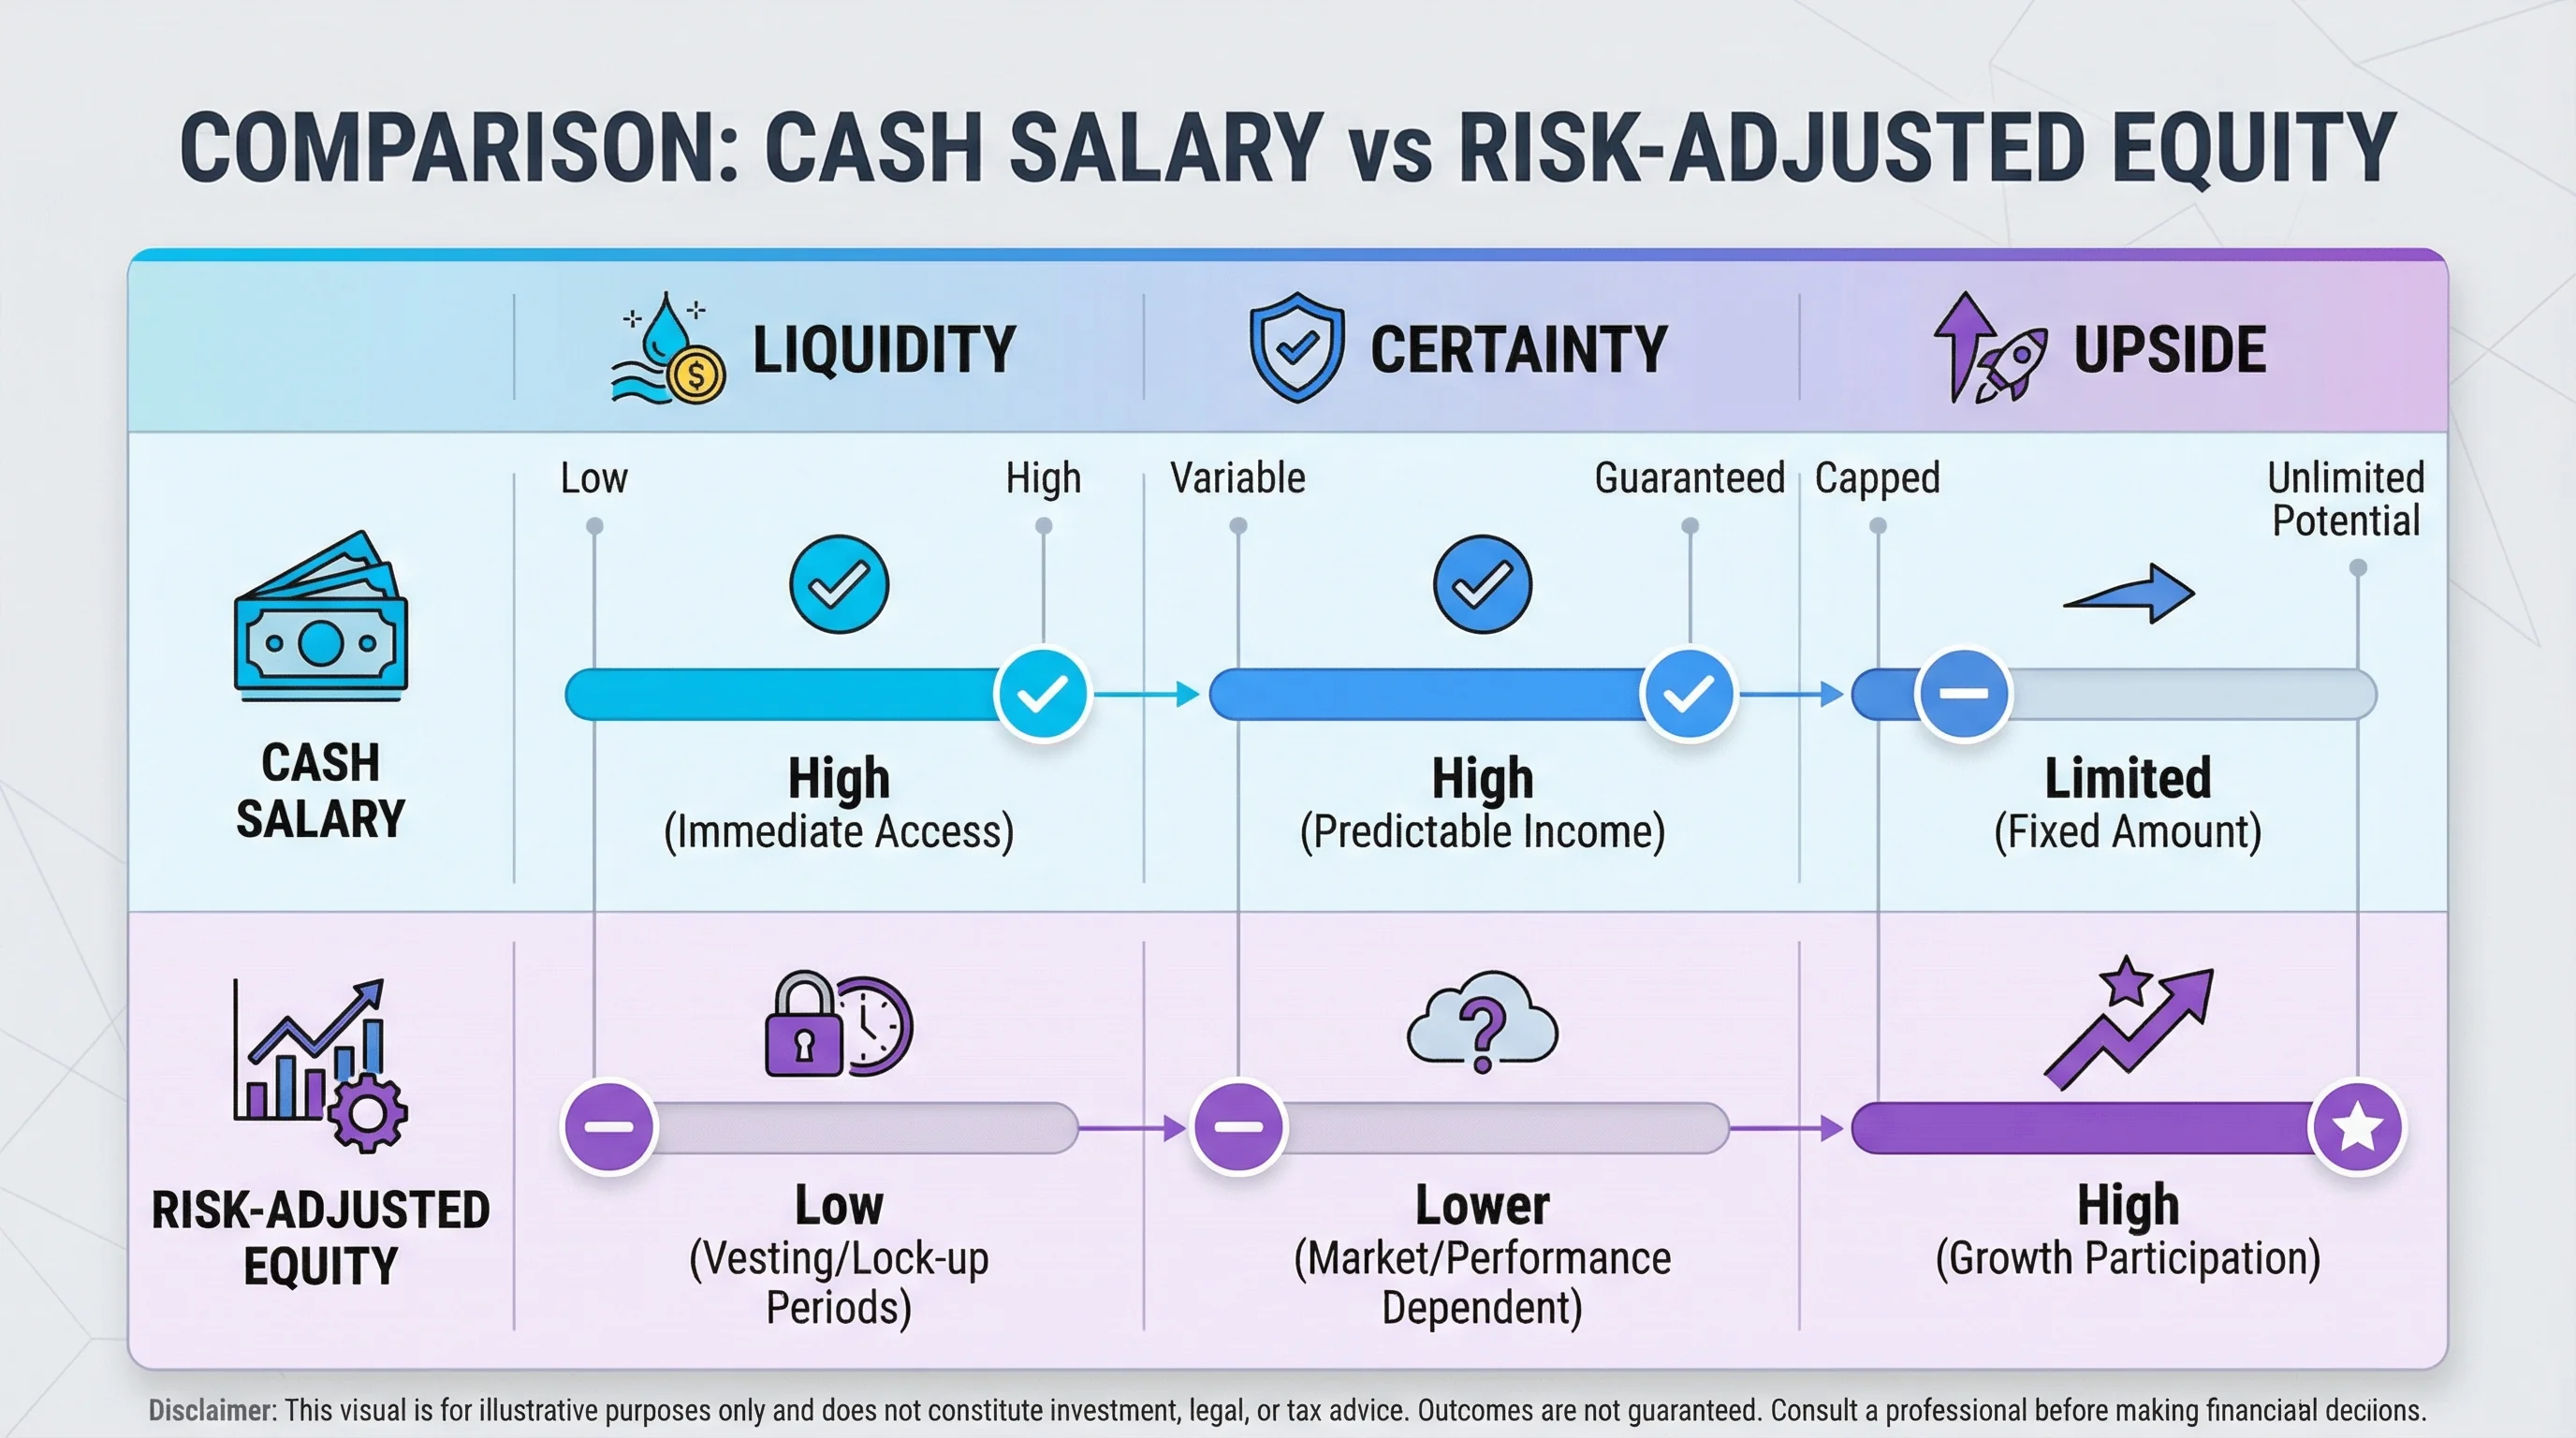
Figure 3: Total comp is more than headline salary—risk and liquidity matter.
Related reading
Disclaimer
Educational only—not investment advice.
Primary sources
| Source | URL |
|---|---|
| Investor.gov | https://www.investor.gov/ |